Highlights from the 2023 Q2 property report:-
- House prices annual change percentage – May 2023 data
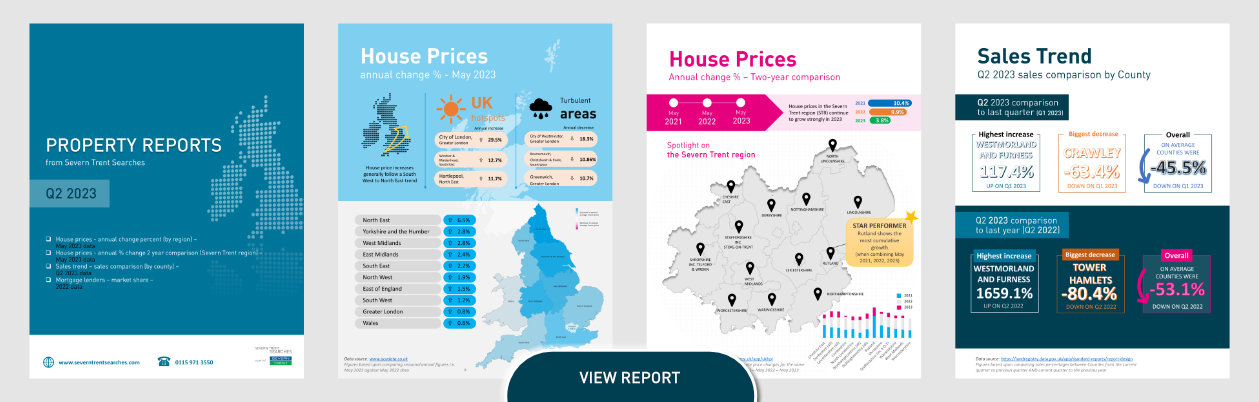
Some impressive gains from all Counties this quarter when compared to last year, with the North East making an 6.5% gain followed by Yorkshire & The Humber at 2.8%. - House prices annual change percentage – two year comparison (May 2023/22/21 data)
Rutland shows the most combined growth of 30.7% with Derbyshire slightly behind at 27.0%. - Sales trend Q2 2023 sales comparison by County
Counties were on average 45.5% down on last quarter and 53.1% down on the previous year (Q2 2022). - Mortgage lenders – market share 2022
Lloyds banking group still hold the number one spot with an 16.8% market share, despite dropping 1.3% from last year. Natwest Group, Nationwide, Santander and Barclays make up the remaining companies in the top five.