Highlights from the 2023 Q1 property report:-
- House prices annual change percentage – Feb 2023 data
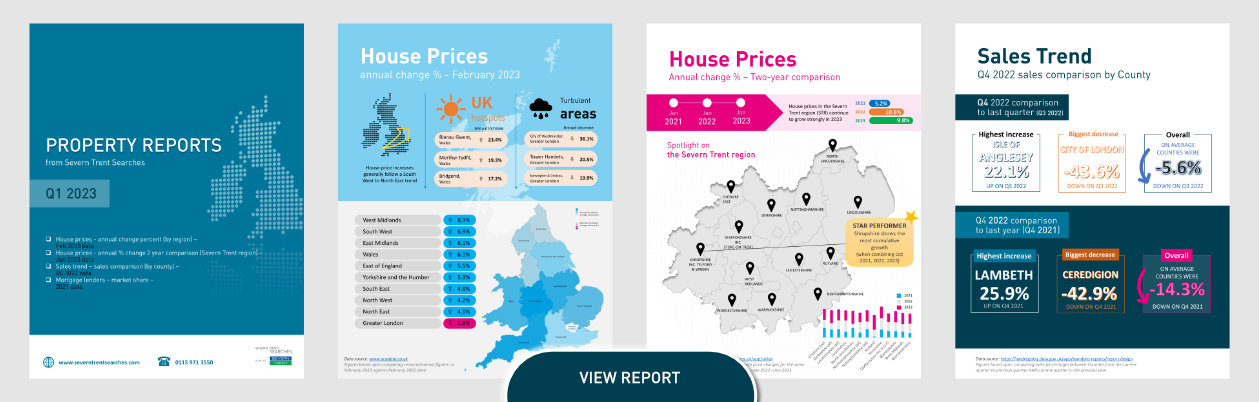
Some impressive gains from all Counties this quarter when compared to last year, with the West Midlands making an 8.9% gain followed by the South West at 6.9%. Greater London has achieved a negative growth of minus 1.8% in Q1. - House prices annual change percentage – two year comparison (Jan 2023/22/21 data)
Shropshire shows the most combined growth of 31.6% with Cheshire East slightly behind at 29.4%. - Sales trend Q4 2022 sales comparison by County
Counties were on average 5.6% down on last quarter and 14.3% down on the previous year (Q4 2021). - Mortgage lenders – market share 2021
Lloyds banking group still hold the number one spot with an 18.1% market share, despite dropping 0.8% from last year. Barclays break into the top five with a 10.7% market share.