Highlights from the 2022 Q2 property report:-
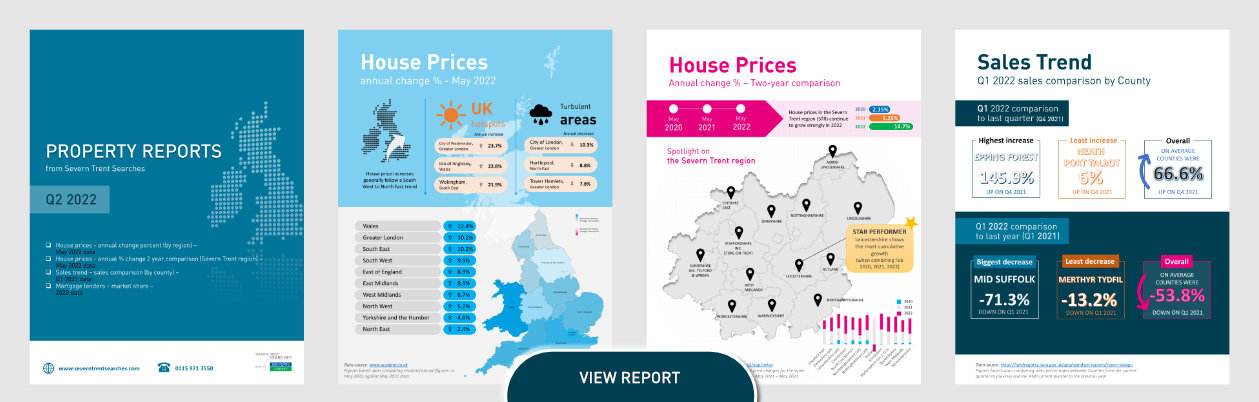
- House prices annual change percentage – May 2022 data
Wales continues to lead the way with an impressive 12.4% gain when compared to last year. As per last month the north has achieved the smallest gains with North East (2.4%), Yorkshire and the Humber (4.8%) and the North West (5.2%) respectively. - House prices annual change percentage – two year comparison (Feb 2022/21/20 data)
Once again, Leicestershire shows the most combined growth of 25.9% with Shropshire and Nottinghamshire slightly behind at 25.6% and 25.1% respectively. - Sales trend Q1 2022 sales comparison by County
Counties were on average 66.6% up on last quarter but 53.8% down on the previous year (Q1 2021). - Mortgage lenders – market share 2020
64.3% of all mortgage lending in the UK goes through the top five providers